Gamma Exposure (GEX) Explained: How Dealer Hedging Moves Bitcoin
TL;DR. Gamma exposure (GEX) estimates how much BTC the options market makers must buy or sell to stay delta-neutral as price moves. When dealers are net long gamma, their hedging leans against every move — they sell rallies and buy dips — and the market tends to grind, mean-revert and pin near big strikes. When they are net short gamma, their hedging chases the move — they buy rallies and sell dips — and the market trends, gaps and cascades. It is a regime lens, not an entry signal. And in crypto the sign of GEX is genuinely uncertain, because nobody outside the dealers knows which side of the book they hold.
Prerequisites for this lesson: The Greeks (gamma above all), Bitcoin options max pain (how open interest clusters at strikes), Crypto volatility trading (what delta hedging is and why anyone does it) and Straddle vs strangle (why gamma explodes near expiry). This is the last lesson of the options track, and it is where options stop being about your position and start being about the market's.
Who the dealers are and why they hedge
An options market maker quotes a bid and an offer on hundreds of strikes and expiries at once. They do not choose their position; they inherit whatever the crowd wants to get rid of. If funds are buying puts for protection and retail is selling calls for "income", the dealer ends up short puts and long calls — a portfolio with a large, changing delta they never asked for.
Dealers do not want directional risk. Their business is the spread, not the forecast. So they hedge: for every unit of net delta in the option book, they hold the opposite amount of BTC in the perpetual or spot market. The book is delta-neutral, and the dealer is indifferent to the next tick.
Except that delta does not stay still. As BTC moves, every option's delta changes — that is gamma — and the hedge that was neutral a moment ago is now wrong. The dealer must trade again. This re-hedging is a flow into the same perpetual order book you scalp in. Unlike most flows it is not a view on the market; it is mechanical, it is predictable in direction, and near large strikes it can be very large.
How large? For a 7-day at-the-money BTC option at 55% IV, gamma is roughly 0.00005 per dollar. With 10,000 BTC of open interest at that strike, a 1% move ($1,000) changes the book's delta by about 500 BTC — some $50 million of perpetuals that someone has to buy or sell, purely to stand still. Multiply across the strikes near spot and you have a participant whose trading is a function of price alone.
Long gamma and short gamma: two regimes
The direction of the dealer's re-hedging depends on one thing: whether the book is net long or net short gamma.
Dealers long gamma (the crowd has been selling options to them). When BTC rises, the calls they own gain delta, so the book gets longer; to stay neutral they sell perps into the rally. When BTC falls, the book gets shorter; they buy the dip. Their hedging is counter-trend. Every move meets a mechanical seller on the way up and a mechanical buyer on the way down. Realised volatility is dampened, breakouts stall, and price tends to oscillate around the strikes where the gamma is concentrated.
Dealers short gamma (the crowd has been buying options from them). When BTC rises, the calls they are short gain delta against them; the book gets shorter, so they must buy perps into the rally. When BTC falls, they must sell into the drop. Their hedging is pro-trend. Every move is amplified by a participant who is forced to chase it. Realised volatility rises, moves extend further than the flow that started them, and liquidation cascades find fuel exactly when the market is thinnest.
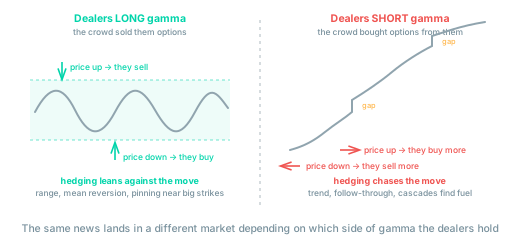
This is the single most useful idea in the lesson, so it is worth stating without jargon: when dealers are long gamma the market has a shock absorber; when they are short gamma it has an accelerator. The same news, the same liquidation, the same whale order produces a different-sized move depending on which regime the options book is in.
The sign flips over time and over price. Traders on the book can be long gamma below spot and short gamma above it, or long in the front expiry and short in the back. What GEX tries to do is add it all up into one number.
Why gamma piles up near strikes and expiries
Gamma is not evenly spread. Two things from earlier lessons decide where it lives:
- Gamma is highest at the money. An option far from spot has almost no gamma; one right at spot has the most. So the hedging flow is concentrated wherever open interest sits close to the current price.
- Gamma grows as expiry approaches. The same at-the-money option has several times more gamma with two days left than with thirty. The lesson on straddles showed why: with little time left, a small move decides whether the option finishes in or out of the money, so delta swings from near 0 to near 1 over a narrow price range.
Put those together and you get gamma walls: strikes with heavy open interest — usually round numbers like $100,000 or $120,000 — that sit near spot in the days before a large expiry. If dealers are long that gamma, price approaching the wall meets increasingly heavy counter-flow, and often stalls or bounces there. Into the final hours before Deribit's Friday 08:00 UTC expiry the effect can look like a magnet. This is the mechanism behind the max pain observation: max pain is the same positioning viewed through open interest, GEX is the same positioning viewed through hedging flow.
Then the expiry passes, the options settle, and the gamma is simply gone. Whatever was holding price in a band is switched off at 08:00 UTC. That is why the hours after a large monthly or quarterly expiry so often produce a clean directional move: nothing has changed in the world except that the shock absorber was removed.
Sheldon Natenberg makes the mirror-image point for the dealers themselves: at-the-money options close to expiry in a quiet market are among the riskiest positions in the business, because a gap cannot be hedged and the gamma is enormous. A dealer who is short that gamma into a Friday morning will hedge aggressively at the first sign of movement — which is one reason expiry mornings sometimes gap rather than pin.
How GEX is calculated — and the assumption inside it
The standard calculation is simple enough to do by hand for a single strike:
GEX per strike ≈ gamma × open interest × spot² × 0.01 × sign
The first three terms turn "gamma per dollar per contract" into "dollars of BTC that must be traded for a 1% move" — the 500 BTC in the example above. The last term, the sign, is where the trouble starts.
To know the direction of the dealer's hedge you must know which side of each option the dealer holds. Nobody publishes that. The conventional shortcut, inherited from US equity index options, assumes that customers sell calls and buy puts — so dealers are long calls (positive gamma) and short puts (negative gamma). Add every strike up under that assumption and you get a single net number. Where it is positive, dealers are net long gamma; where it crosses zero as you move spot up or down is the gamma flip level, the price at which the regime changes.
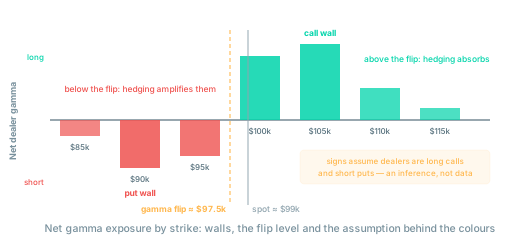
In crypto that shortcut is on shakier ground than in equities, for reasons you now have the background to see:
- Retail in crypto sells a lot of calls — the covered-call and "vault" programmes from the selling options for income lesson are large, systematic sellers of upside. That supports the "dealers long calls" assumption.
- But retail also buys a lot of calls in bull markets, as lottery tickets. In those phases dealers can be short calls above spot, and the sign of the biggest bars flips.
- Puts are bought for protection and sold for yield, sometimes by the same funds in different months.
- Some analytics providers infer the dealer side from who initiated each trade (the taker), which is better than a blanket assumption but still a guess about a book that rebalances constantly.
The honest summary: the magnitude of gamma at each strike is solid — open interest and gamma are public. The sign, and therefore whether the regime is "absorb" or "accelerate", is an inference. Any tool that shows you a confident green-and-red GEX chart is showing you its assumption as much as the market.
Reading it as a scalper: regime, not signal
None of this tells you when to click. What it does is tell you what kind of day you are likely in, and that changes which of your setups deserves size.
Net long gamma regime (positive GEX, spot between the walls). Expect a market that mean-reverts. Breakouts fail more often than usual because the first push meets mechanical selling. Ranges hold longer. Realised volatility runs below implied. This is the environment where range-fade and narrow-range setups earn their keep, and where chasing a breakout on the first candle is expensive.
Net short gamma regime (negative GEX, or spot below the flip level). Expect follow-through. Moves that would stall in a long-gamma regime extend, pullbacks are shallow, and a liquidation cascade has an extra participant selling into it. This is trend-scalping and wide-range territory, and the regime where a tight fade stop gets run.
Around big expiries. Gamma builds into the Friday, the range tightens, then at 08:00 UTC it is switched off. Plan the session in two halves: pinned before, free after. Watch the strikes with the largest open interest as the places where flow changes, not as support and resistance in the classic sense — nobody is defending them, the hedging simply gets heavier there.
A number to compare, not a line to trade. The most useful way to use GEX is alongside the other options-derived lenses from this track — DVOL for the level of fear, skew for its direction, open interest for its size. When all of them say "calm, long gamma, low skew" and price is drifting toward a big strike on a Thursday, you have a description of the regime, and the order flow on your screen decides the trade.
The traps
- Trading GEX levels naked. A gamma wall is a place where hedging flow intensifies. It is not a level anyone is obliged to defend, and it disappears at expiry. Treating it as a support line and buying it blind is how a regime tool becomes a losing signal.
- Forgetting the sign is a guess. A confident "positive GEX" reading can be negative in reality if the crowd has been buying calls rather than selling them. The regime you infer can be exactly backwards.
- Believing long gamma means safe. The shock absorber has a limit. A move large enough to carry spot beyond the strikes where dealers are long converts them into short-gamma hedgers on the way out — which is why long-gamma ranges often end with the largest breaks, not the smallest.
- Overweighting options in a perp-dominated market. In BTC the perpetual market is many times larger than the options market. Dealer hedging is one flow among several, meaningful near large expiries and heavy strikes, and easily drowned out by a funding-driven squeeze or a whale on the other days. In equities the tail wags the dog; in crypto it mostly does not, yet.
- Confusing cause and effect. Calm markets make sellers of options comfortable, which makes dealers long gamma, which makes markets calm. The loop runs both ways; the regime is a description, not an explanation.
The end of the track
You started this section with what a call and a put are. You now have a way of looking at the perpetual market that most participants in it do not have: the level of implied volatility tells you how much fear is priced, the skew tells you which direction it points, the term structure tells you when it is expected, max pain and open interest tell you where the positions are, and gamma exposure tells you what those positions will mechanically do to price as it moves.
Not one of these is a trading signal. Together they answer a question the chart cannot: where is the big money positioned, and what does it need from price to be right? Everything else — the entries, the stops, the exits — stays where it always was, in your scalping playbook and your risk rules.
Related guides:
- Options Greeks explained — gamma as the rate of change of delta, and why it peaks at the money near expiry.
- Bitcoin options max pain — the same positioning viewed through open interest.
- Crypto volatility trading — delta hedging from the dealer's side of the table.
- Crypto open interest — the raw input behind every GEX chart.
- Crypto liquidations — the other mechanical flow that short-gamma hedging amplifies.
- Deribit guide — where the open interest lives, and the 08:00 UTC expiry clock.
- Crypto options hub — the full lesson track.
This article is educational content, not investment advice. Trading derivatives, including options, carries substantial risk, including total loss of capital. See disclaimer.