The Breakout-Retest Strategy
TL;DR. A breakout is when price moves decisively beyond a significant support or resistance level. A retest is when price returns to that level from the other side — the old resistance now acting as support, or vice versa. The entry is not at the break; it is at the retest. The break tells you a level has been overcome. The retest tells you whether that move is being defended or reversed.
Why not enter the break itself
The immediate reaction to a price breaking through a major level is familiar: it feels like a clear signal, the move is already happening, and missing it feels costly. This impulse causes more losses than almost any other decision in scalping.
The problem is not that breakouts are rare. It is that the initial break and a genuine breakout look identical in the first seconds. Price breaking through resistance with a large candle can mean:
- A genuine breakout driven by real new buying pressure
- A stop hunt — price spiked to trigger the resting stop-loss orders clustered above the level, absorbed that liquidity, and is now reversing
Both look the same on the initial candle. The difference only becomes visible in the behaviour that follows.
Entering at the initial break means you are committing before that evidence exists. The traders who do this on every breakout pay for the genuine ones and the fake ones equally.
The five phases
A well-structured breakout-retest setup moves through five distinct phases. Seeing them clearly — and knowing where in the sequence you are — is the core skill.
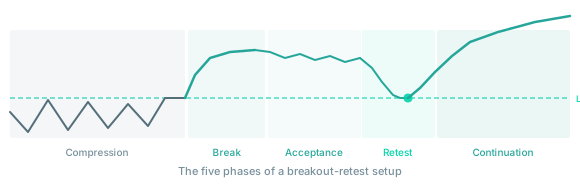
Phase 1 — Compression. Price oscillates in a range, repeatedly testing the boundary without breaking through. Volume typically declines during extended compression — the market is resting, waiting. This is where the setup begins to load. The longer and tighter the compression, the more energy is typically released when it ends. See range trading for how to read this phase.
Phase 2 — The break. A candle closes decisively beyond the level. The key word is closes — a wick that punches above resistance and then reverses is not a breakout, it is a test. A body that closes clearly outside the range is a breakout candidate. Volume on the breakout candle should be above the recent average; a breakout on thin volume is suspicious.
Phase 3 — Acceptance. Instead of immediately reversing, price consolidates above the broken level for multiple candles. This is what separates a genuine breakout from a spike-and-reverse. The market is, in effect, adjusting its sense of fair value. Participants who were short are covering; new longs are entering at the new, higher level. The consolidation does not need to be long — two or three candles holding above the level is enough. But some period of acceptance must happen.
Phase 4 — The retest. Price naturally pulls back toward the level it broke through. This is the setup's actual entry signal. The old resistance has theoretically become support — the same price that previously capped rallies should now attract buyers. How price behaves at this moment is the decision point.
Phase 5 — Continuation. If the retest holds, price should resume moving in the breakout direction, typically with some momentum. The measured-move target (described below) gives a first reasonable destination.
What a valid retest looks like
The retest phase is where the setup either confirms or fails. Several things to observe:
How the pullback develops. A healthy retest is a gradual drift back toward the level — price losing momentum, volume declining, the pullback candles getting smaller. This suggests the sellers driving the retest are not aggressive; they are simply taking profit on the initial move. An aggressive, high-volume return to the level is a warning sign that the break may be reversing rather than retesting.
What happens at the level itself. Price returning to the level and immediately bouncing — a clear reaction, a reversal candle, a spike in buying volume — is the confirmation you are looking for. Price returning to the level and slowly grinding through it, or pausing and then continuing lower, is the setup failing.
The candle at the level. Specific candle patterns (hammer, bullish engulfing, pinbar) at the retest level reinforce the signal. They are not required, but their presence increases confidence. Their absence is not disqualifying. What you are looking for is any visible sign that buyers are defending the level.
How far below the level price is allowed to go. The old resistance becoming support does not mean price must stop at the exact number. It means price should stop within the zone — the range around the level, not a precise tick. A small wick below the level that closes back above it is consistent with the setup. A close clearly back inside the old range is not.
Two outcomes at the retest
The retest either holds or it does not. Both outcomes are informative.
If the retest holds: the setup is active. Enter in the continuation direction, with your stop below the retest low (for a bullish breakout) — if price closes back inside the range, the setup has failed and the position should be closed. The first target is the measured move.
If the level is recaptured: price has returned inside the old range. The breakout has failed. This is the stop-hunt reversal scenario — the move above resistance was not genuine accumulation but a trap. In this case you want to be out of any long you entered on the retest (hence the stop placement below the zone), and possibly interested in the short side.
A failed retest is not a loss of information. It is important information — it tells you the breakout was absorbed and the prior range remains relevant.
Target and stop placement
Stop loss: placed below the retest low (bullish setup) or above the retest high (bearish). If the retest candle has a clear low, that is the reference. The logic: if price returns inside the old range, the premise of the trade is wrong. Exit cleanly. The stop should be far enough below the retest low to allow for normal price noise within the zone, but not so far that it erodes the trade's risk/reward.
First target — measured move: take the height of the range that preceded the breakout (distance from the bottom of compression to the breakout level) and project it above the breakout level. This gives a first-pass, price-derived target. It is not a guarantee — it is a calibration. The measured move concept reflects the idea that the energy loaded during compression tends to be released in a similar magnitude on the breakout.
Second target — next significant level: beyond the measured move, look for the next meaningful resistance on the higher-timeframe chart. That level is where you want your second partial target and where you should consider tightening your trailing stop.
What kills the setup
High-impact news during the setup. A sharp macro event, a major exchange announcement, or a sudden spike in DVOL can invalidate any technical setup. If you are in a retest entry and unrelated news creates a violent move, the level's significance is temporarily overridden. Manage the position accordingly.
Low volume on the entire sequence. A breakout on below-average volume followed by a retest on even lower volume is a setup with no conviction behind it. Both the break and the retest should have volume that confirms participation.
Timing against the higher timeframe. A bullish breakout on the 5-minute chart is weaker if the 1-hour chart shows price at a significant resistance zone. Multi-timeframe alignment is not required, but misalignment is a genuine headwind.
Repeated tests before the retest. If price breaks the level, comes back to test it, bounces, comes back again, bounces, comes back a third time — the level is not holding cleanly. Each successive test at the same level is consuming the resting orders there. A clean breakout retest does not require repeated defence of the same zone.
Further reading
- Support and resistance — the foundation: what levels are and why they hold.
- Range trading and breakouts — the compression phase in detail.
- Stop-hunt reversal — what a failed breakout-retest often becomes.
- Candlestick patterns — the candle behaviour to look for at the retest.
- Open interest — how OI behaviour during the breakout gives additional context.
This article is educational content, not investment advice. Trading derivatives carries substantial risk, including total loss of capital. See disclaimer.