Candlestick Charts Explained
TL;DR. A candlestick shows four prices for a given period: Open, High, Low, and Close. The coloured body shows the range between open and close; the thin lines (wicks) show the extremes. Green means price closed higher than it opened — buyers dominated. Red means sellers dominated. Reading candlesticks is reading the battle between buyers and sellers, period by period.
A brief history
Candlestick charts originated in Japan in the 18th century, developed by rice traders to track price movements in the Osaka futures market. Munehisa Homma, often credited as the father of technical analysis, observed that market prices were driven not just by supply and demand but by traders' emotions — fear and greed. He developed a system to visualise these dynamics graphically.
The method was largely unknown in the West until Steve Nison introduced it to Western audiences in the 1980s and later documented it comprehensively in Japanese Candlestick Charting Techniques (1991). Today, candlesticks are the default chart type across virtually every trading platform in the world.
Anatomy of a candlestick
Each candlestick represents a single time period — one minute, one hour, one day — and encodes four prices:
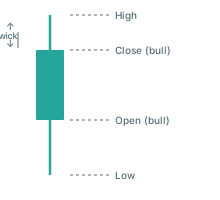
- High — the highest price reached during the period (top of the upper wick).
- Low — the lowest price reached (bottom of the lower wick).
- Open — the first trade price of the period.
- Close — the last trade price of the period.
The body (the wide rectangle) spans from Open to Close. It is the most important visual element — it shows who won the period: buyers or sellers.
The wicks (also called shadows or tails) show how far price extended beyond the body before being pushed back. A long upper wick means buyers briefly pushed price high but sellers forced it back down. A long lower wick means sellers briefly pushed price low but buyers bought the dip.
Bullish and bearish candles

Bullish (green)
Close > Open

Bearish (red)
Open > Close
A bullish candle (green/white) means price closed higher than it opened. Buyers controlled the period. The body extends upward from open to close.
A bearish candle (red/black) means price closed lower than it opened. Sellers controlled the period. The body extends downward from open to close.
The size of the body relative to the total candle (including wicks) matters. A large body with small wicks means one side dominated cleanly. A small body with large wicks means neither side could hold its gains — indecision.
What a single candle tells you
A candle is a compressed story about one time period:
- Where did we start? (Open)
- How far did buyers push it? (High)
- How far did sellers push it? (Low)
- Where did we end up? (Close)
The relationship between these four prices tells you who was stronger, how decisive the move was, and whether the winning side is still in control or exhausted.
A large bullish candle closing near its high — buyers dominated from open to close, sellers could not push it back. Strong conviction.
A candle with a large body but closed far below its high — buyers made progress but sellers fought back hard before the period ended. Contested.
A candle with almost no body and wicks in both directions — neither side won. The market is deciding. Often appears at key levels or before significant moves.
Timeframe context
The same candle looks different depending on the timeframe.
A 1-minute candle represents 60 seconds of trading. A daily candle represents an entire trading session. The patterns and signals described in this series apply to any timeframe — but for scalping, the 1-minute to 15-minute charts are most relevant.
An important rule from Nison, validated by decades of practice: a candle's meaning depends heavily on its context. Where it appears in the trend, what level it is near, what volume accompanied it — these factors determine whether a pattern is significant or noise.
We will return to context throughout this series. For now, understand that no candlestick pattern is a reliable signal in isolation. It is a piece of evidence to be combined with others.
Why candlesticks matter for crypto scalping
In crypto perpetual futures markets, every price move is driven by human decisions — which means fear, greed, and hesitation show up in candlesticks just as they did in 18th-century Japanese rice markets.
Specifically useful for scalpers:
- Wick length at key levels — long wicks at support or resistance signal rejection, a key scalping signal.
- Candle size vs recent average — a sudden large candle versus a series of small ones signals a momentum shift.
- Body position within range — closing near the high vs near the middle vs near the low tells you different stories about who has control.
These observations are fast — they require no calculation, just trained attention. That is why candlestick reading remains one of the most practical skills for any active trader.
What comes next in this series
- Single-candle reversal patterns — Hammer, Hanging Man, Shooting Star, Doji
- Two-candle patterns — Engulfing, Dark Cloud Cover, Piercing Line, Harami
- Three-candle patterns — Morning Star, Evening Star, Three White Soldiers
- Candlesticks in scalping context — How to apply these patterns with proper context
This article is educational content, not investment advice. Trading derivatives carries substantial risk, including total loss of capital. See disclaimer.